Intro
App debugging is an essential part of the app development lifecycle. Bugs can be insidious, and we need to find them as fast as possible to get more time for fixing. Yes, of course, it would be great to write code without any issues that work just perfect, but we are people, and it’s a normal thing to make mistakes. In this article, you will read about some useful & fun tools that I prefer to use in my day to day iOS app debugging. We will touch a few themes like:
- Signpost
- Charles Proxy
- Chisel
- Breakpoints
You might already be familiar with some of them, but I hope you will find out something helpful and optimize your workflow using tips and tricks below. Have a nice reading 🚀.
Signpost
On WWDC 2018, Apple introduced a new method so_signpost, for os_log framework. That is available from iOS 12.
So, let’s check Apple’s documentation for it:
Marks a point of interest in your code as a time interval or as an event for debugging performance in Instruments.
It looks like signpost is a custom marker, that can make our work with Xcode Instruments a little bit easier.
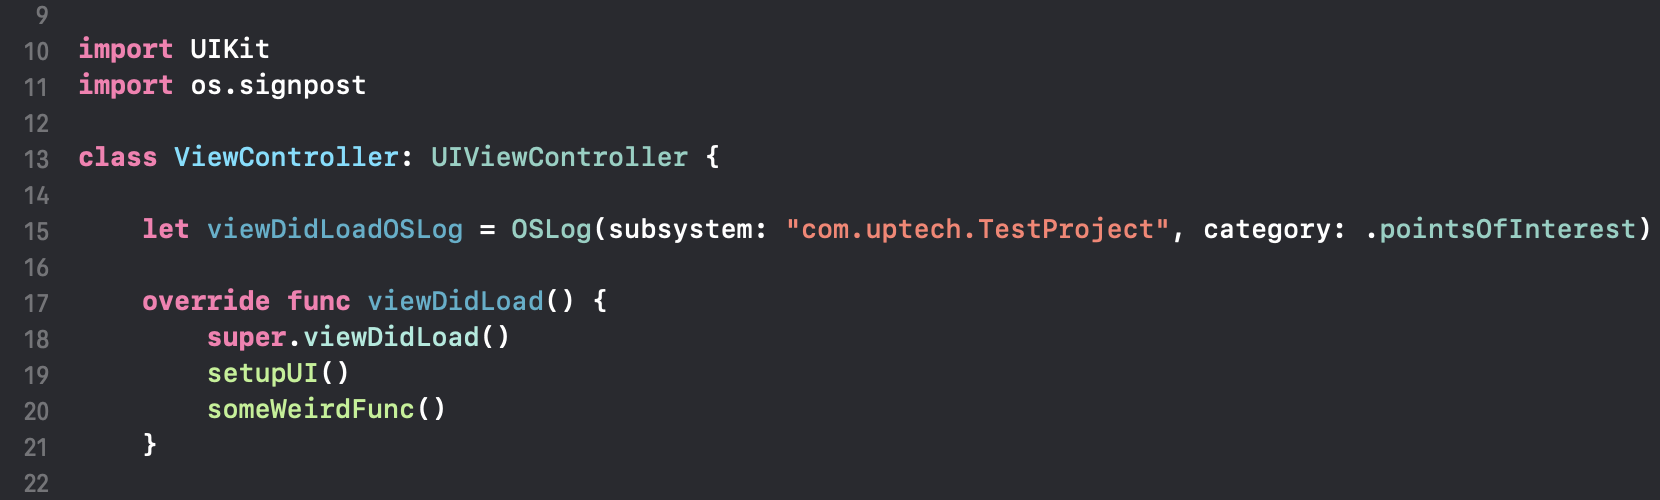
For example, we need to check what happens in viewDidLoad method on some specific screen. We can do it with just a few steps:
1. Initialize OSLog object by passing a few parameters. Bundle identifier to subsystem: and .pointOfInterest to category:. The last one will help us to display our logs in Point of Interest instrument.
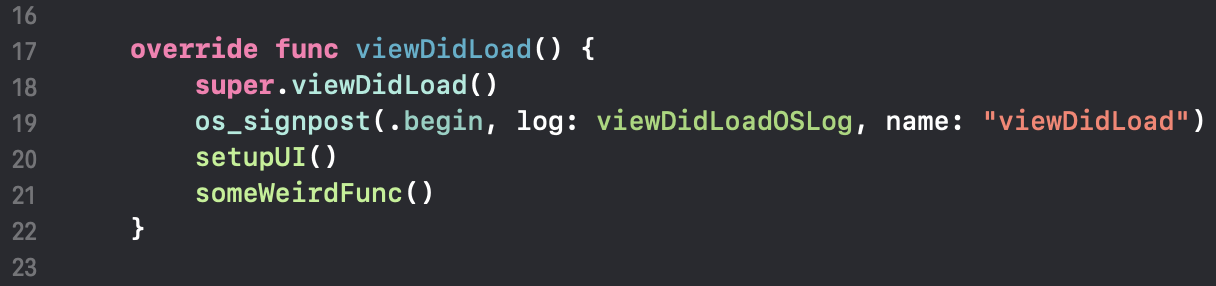
2. Calling os_signpost for the first time with OSSignpostType.begin, passing our log object and set the name of our measurement.
3. Balance call of os_signpost with OSSignpostType.end
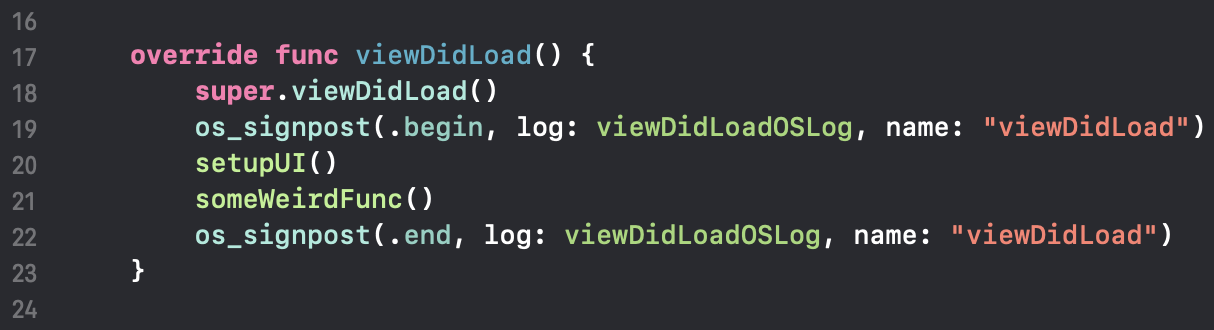
That’s all, let’s profile it!

As a result, Point of Interest will display a measurement event on the timeline, and we can easily find a place that we were interested in.
Charles Proxy
Charles is an excellent app for network debugging. But it can do more than just displaying requests or responses.
Sometimes you need to get some specific data from your API to reproduce a specific behavior. You can do this without any changes in your codebase by mocking the response in Charles.
First of all, let’s make it work with iOS simulator. We need to install a root certificate. Help -> SSL Proxying -> Install Charles Root Certificate in iOS Simulators

*Make sure you close a simulator before doing it, otherwise it will not work.
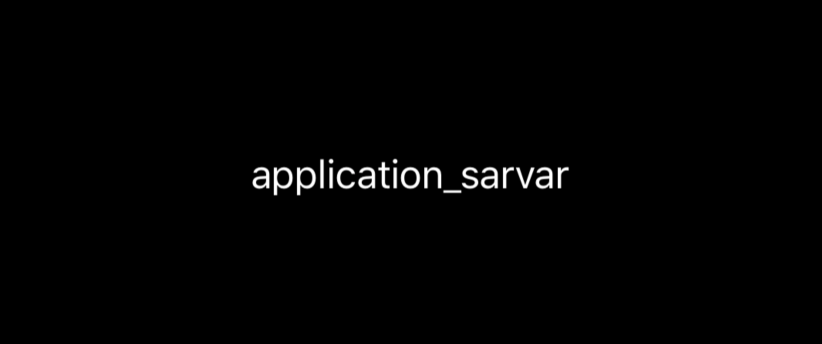
So, we have a simple app that sending a request to the server and display response in a label:
To mock a response we need to do a few steps:
- Find a request that you are interested in and open a context menu (right-click), choose Save a response. (Save it as a .json file)
- In the same context menu, you need to select Map Locale. You will see an Edit Mapping window.
- Fill a Local path field with your path and press OK.
Nice, our response mocked! Now we can modify a JSON file. On the next request, you will get an expected response.
Also, we can do the same with breakpoints that might also be useful.
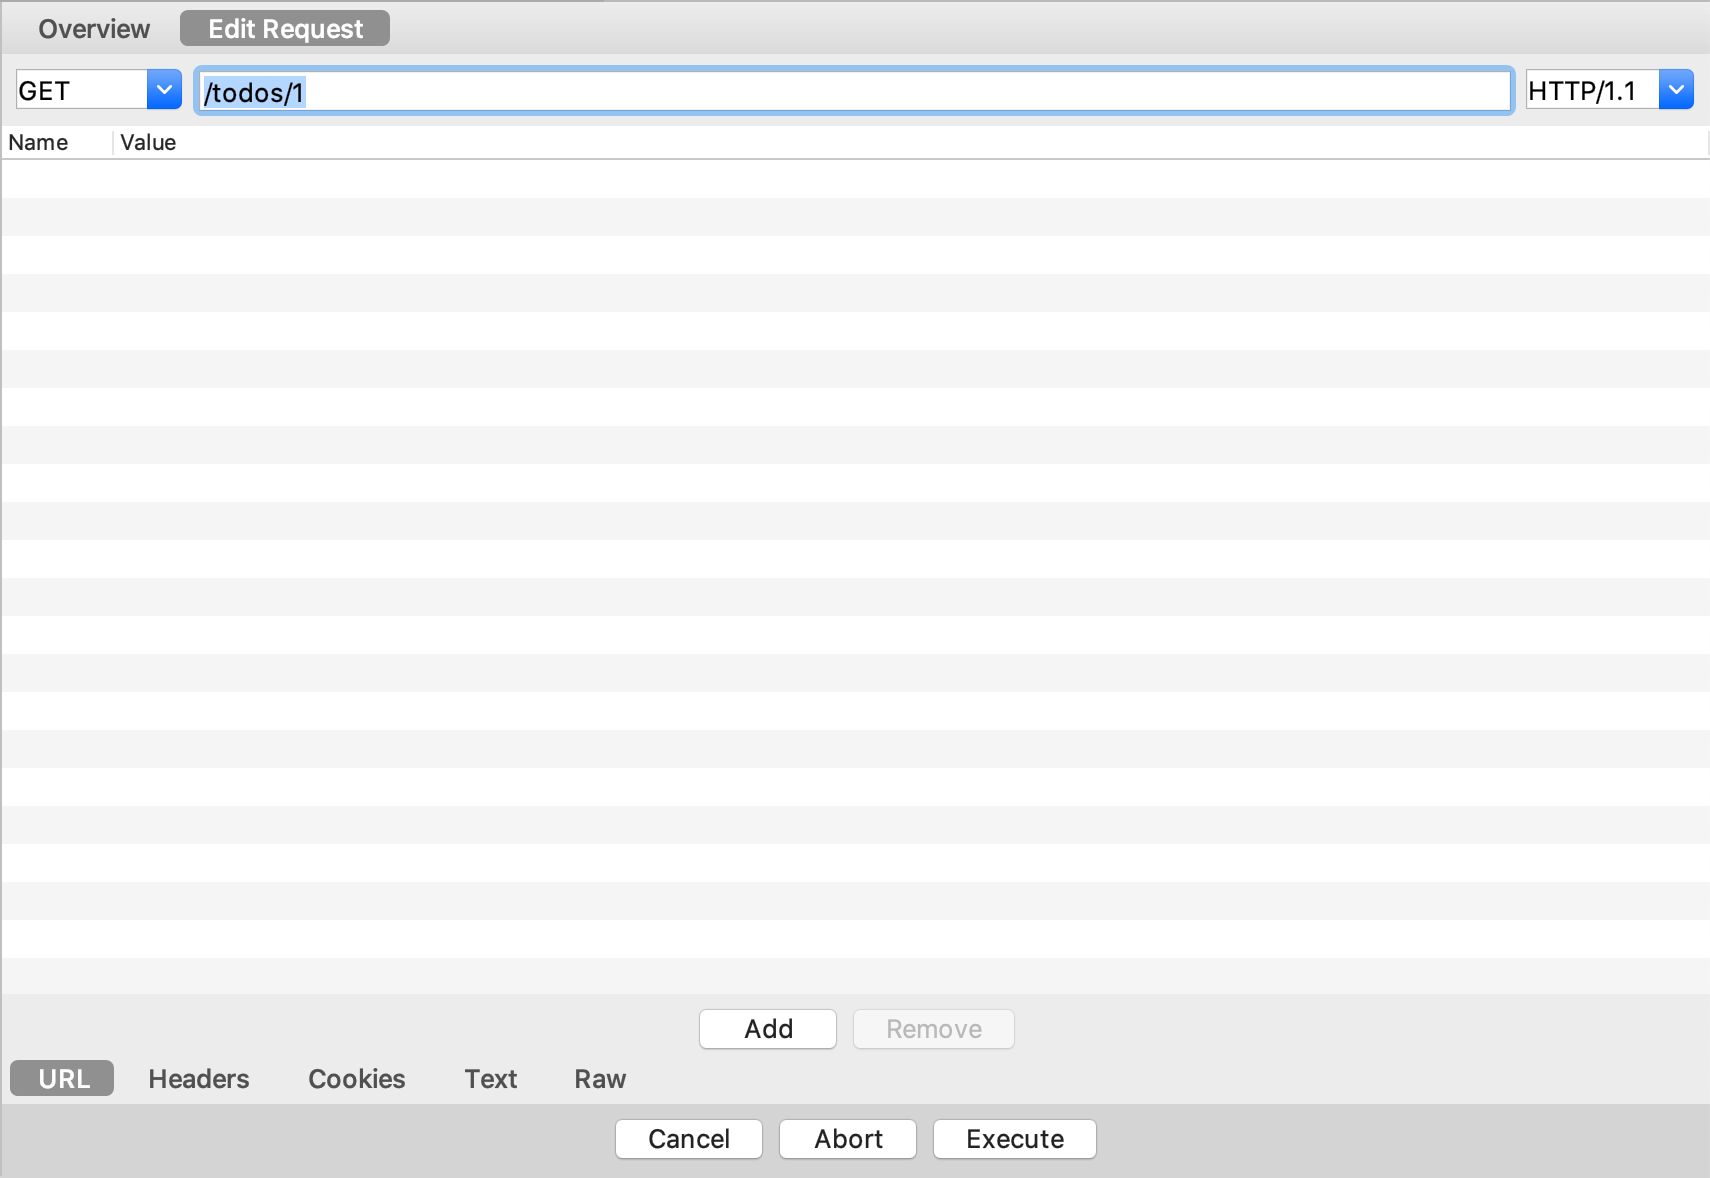
1. Select a request and open a context menu (right-click), choose Breakpoint.
2. After making a request in the app, the breakpoint will be triggered, and Charlies will show a window where you can modify headers, body, etc. Press Execute to continue.
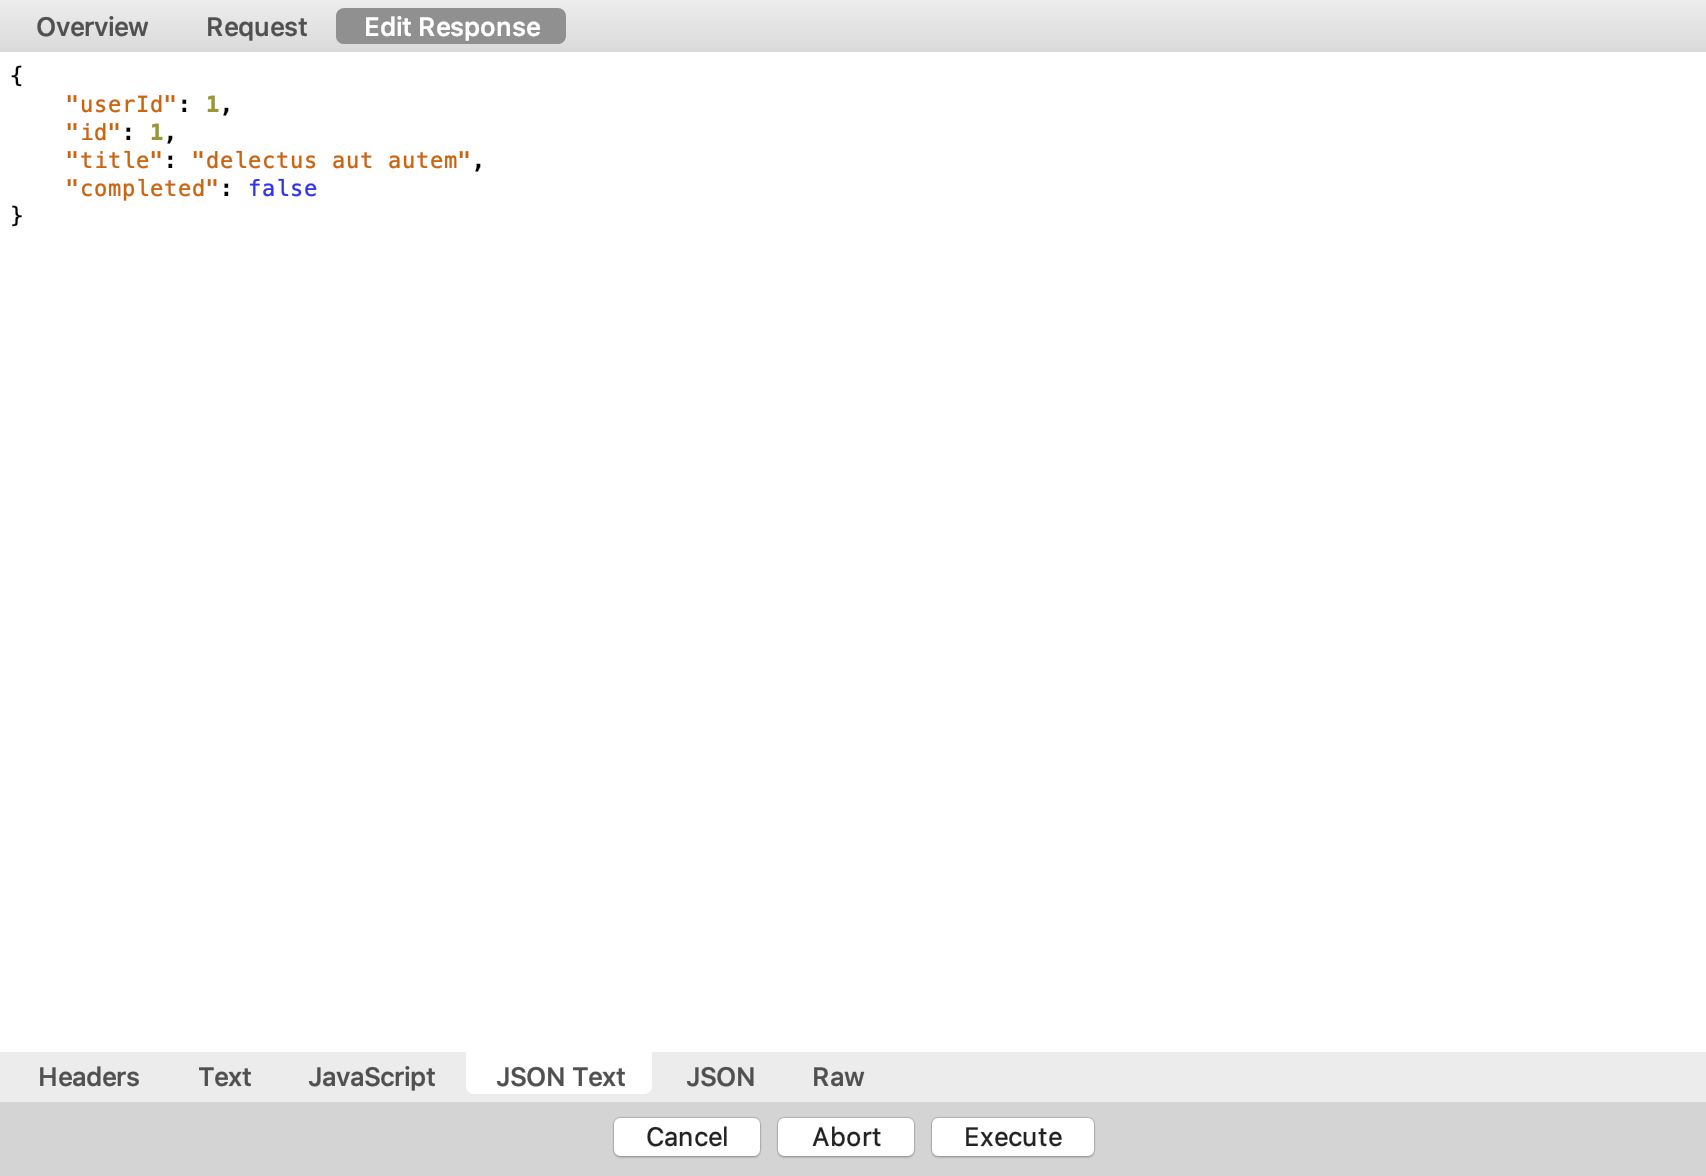
3. When you get a response, a window will be updated. Now you can modify a response body, code, and headers. Press Execute to pass a response to the app.
Chisel
Some great engineers from Facebook created a repo named Chisel. It is a collection of LLDB commands that can help you improve your debugging session. You can find an installation guide here. Chisel has a big list of available commands. I will show a few of them below.
1. taplog
taplog will set a breakpoint to -[UIApplication sendEvent:] and some conditions to filter all touch events.
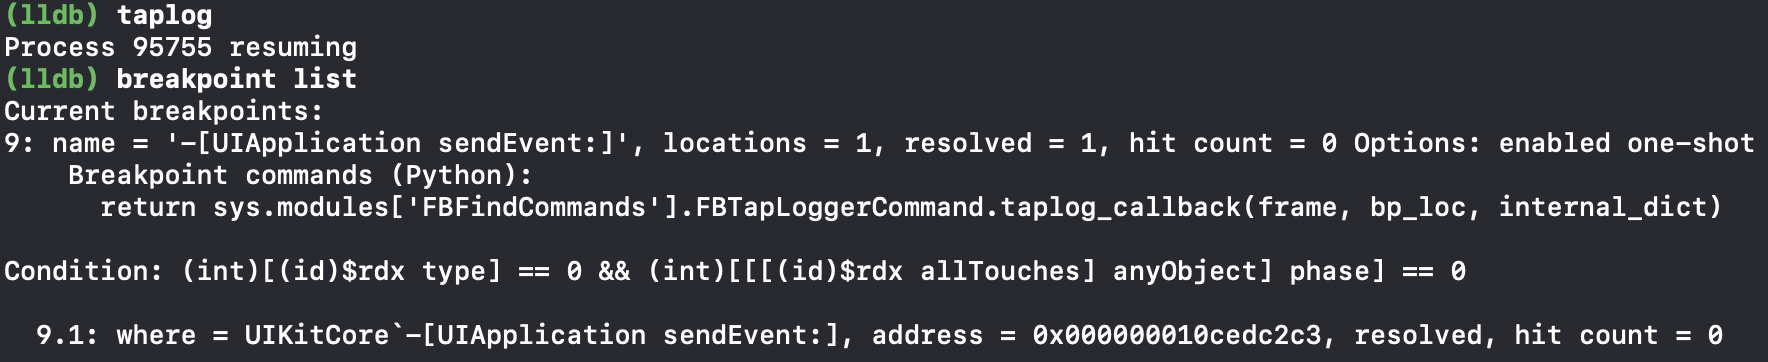
After any touch event, the breakpoint will be triggered and print a debug description about the object to the console.
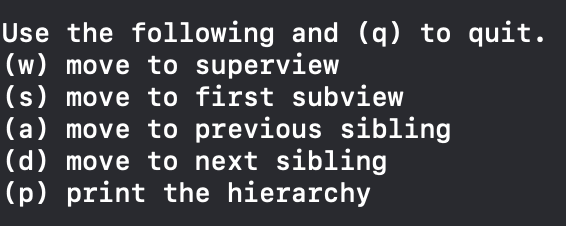
2. vs
I didn’t find this command useful to myself, but it actually can take you on a short interactive trip through your views hierarchy with some visualization.
The interface looks like this:
3. pviews
It’s a simple command that prints the view hierarchy.

4. flicker, mask & border
I put these 3 commands in one part cause they are for the pretty same purpose. They can help you find UI elements faster.
- flicker will show and hide element to make some flickers effect.
- mask will add a red layer to view.
- vs and border will add borders around.
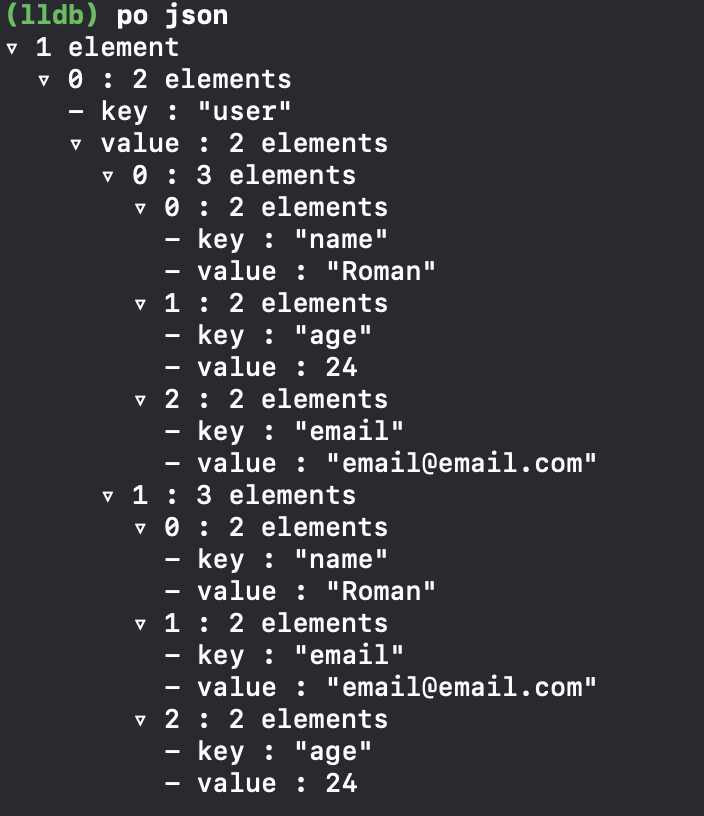
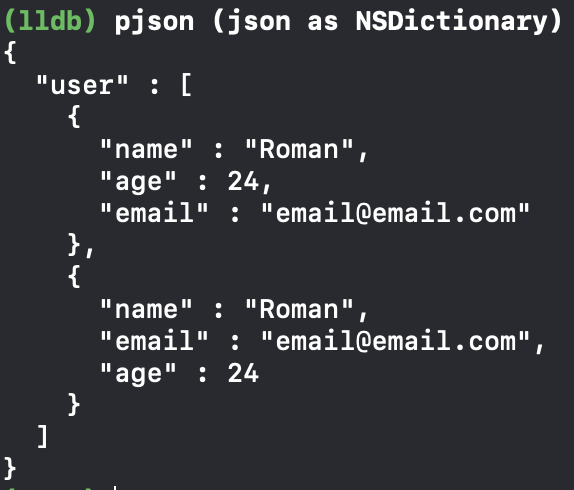
5. pjson
It’s a nice command that formats a default printing description of NSDictionary or NSArray to a regular JSON.
From this 👇🏻
Bad formatting
To this 👇🏻
Good formatting
Amazing! What can be better?
Breakpoints
Breakpoints in LLDB are powerful and easy to use with Xcode UI. In this part, I will talk about some exciting features that can be useful.
1. Conditions
Probably you already know about it but anyway let’s take a short look.
To set a condition, you need to right-click on the breakpoint and choose Edit Breakpoint. On the image above, it will be triggered when the counter will be more than 2.

2. Debugger command
Breakpoints can execute a LLDB command through actions. Here a small example:

thread jump -by 1 will skip the current line. In this case, if a condition is passed, we will go directly to updateLabel function without increasing the counter.
3. Apple scripts
Let’s imagine for a second that you need to hear something when a breakpoint was triggered? You actually can do it, since breakpoint also supports an Apple Script.

Okay, to be serious AppleScript is a powerful and simple language. You can do a lot of stuff through it, like making a screenshot, send notifications, etc.
4. Sound
Breakpoints also support a default system sounds; theoretically, you can play a custom one through AppleScript but it’s more for fun 😄.

Usage of sounds can be helpful if you are doing a live debugging and need to make sure if some code calls ones.
5. Log message
This one can be useful in case you need to log some expression without adding a print function and rebuilding the project. Also, we can make MacOS speak it (like we did with AppleScript).

Although very useful, these tips & tricks for iOS app debugging are not hard to learn. Start using them as soon as possible and enjoy less time wasted on debugging and flawless apps.
Thank you for your time. Don’t forget to put some claps and leave comments if you enjoyed (or not) this article.
Peace. Love. Uptech. ✌🏻
Useful links:


.avif)