
It often happens that app developers focus more on app development, giving little or no attention to post-development activities, like monitoring iOS app performance. And that’s a pity!
Like dessert matters no less than the main dish, iOS app performance bears no less importance than app development itself. If your app makes the user accomplish their goal quickly and smoothly – they would be happy. Conversely, in case of lags and freezes, the user is more likely to be left frustrated. And this can definitely take a toll on your business goals.
It is a mistake to think that when you spend 1 day saving 300ms of UX time, that's a waste. In reality, when you have 100k audience, you will save 30k seconds for them in total (8hrs 20mins)
So in this article I want to share my insights on the following issues:
- What is Metrickit and how to set it up
- Types of MetricKit metrics
- How to use Metrickit to monitor iOS development performance (examples of signposts requests).
So let’s dig right in!
What do we mean by iOS app performance?
Performance of an iOS application is a combination of multiple things:
- Reasonable app launch time;
- Considerate memory usage;
- Frequency of disk writes;
- Battery consumption.
- Frames per second (FPS);
- Cellular data usage.
Also, good performance means that every component works flawlessly. Smooth interface and quick responses improve user experience and engage more users to use the app. So, it is important to measure app performance and constantly improve it to leave users happy and make them return to the app. Metrickit is a great tool to track iOS app performance.
What is MetricKit?
MetricKit is a framework that helps to aggregate and analyze per-device reports on exception and crash diagnostics, and on power and performance metrics. It is a powerful tool that provides real access to performance data from all users’ devices, using the application. Also, this tool can help find trends and patterns in performance regression.
How to set up MetricKit?
It is very easy to start using MetricKit in your project. In fact, it takes only three steps to start:
Step 1. Import MetricKit framework into your code.

Step 2. Create a shared instance of a class that is the entry point of interaction with framework, let’s call it MetricManager.

Implement a provided subscriber delegate protocol and that’s it, you are ready to get metrics from the framework.

Example of payload:
Note: MetricKit requires iOS 13 or higher, so if your project supports iOS versions that are lower than iOS 13 then you need to add an availability check.
Types of metrics to track with MetricKit
MetricKit collects a lot of different metrics that help you understand the performance of your iOS app. Among them there are such metrics as battery, performance, responsiveness, disk access, custom metrics and data types.
There is no need to use each of these metrics for every iOS app you want to track. For example, if you don’t use a local database and rarely save files on the phone then metrics related to disk writes are not so important.
But I would like to talk about the metrics that are commonly important for any iOS app. Here is the list:
- Location activity metric
- Network transfer metric
- App exit metric
- App launch metric.
- Custom Metrics
Location activity metric
It shows the information on how long the location was activated for every accuracy type. It is useful in case your app uses LocationManager, you are able to see whether some numbers are too high and you can investigate it.
Network transfer metric
It shows how much data is uploaded and downloaded with cellular connection and with WiFi connection.
App exit metric
This is a very important metric, as it can show the reasons why your app exists for foreground and background modes. For example, the reasons for background mode exists may include: using too much memory, using too much CPU, invalid memory access and others.
App launch metric
This one shows how much time the app needs to launch. Decreasing the launch time improves user experience and makes it less probable that the iOS watchdog will terminate the app.
Custom Metrics: Signpost metric overview
Among various Metrickit metrics, there is one that deserves special attention – Signpost. This is a custom metric that allows developers to measure computation.
Signpost metric can be useful in many cases, for example measuring performance of network requests.
Many iOS apps interact with some external services and this provides a good opportunity to track performance. For example, you can track the number of requests and time of request.
With these measurements you can define which requests are used most often and also what can be optimized (in case the time of request is increasing).
Using MetricKit to Track Performance: Step-by-Step Guide
Finally, as we have seen into value and types of metrics, we are moving on to the process of measuring iOS app performance. I personally would break it down into 3 steps:
Step 1
First, you need to create a class that will handle logic with signposts, like in the example below:

Step 2
Interface of this struct is pretty simple. You need to call `logger.beginLog(name: ”example”)` before request and `logger.endLog(name: ”example”` after getting a response.
Step 3
You logged the information about the request but you need to retrieve it back. To do this you need to add code to didReceive(_ payloads: [MXMetricPayload]) method:
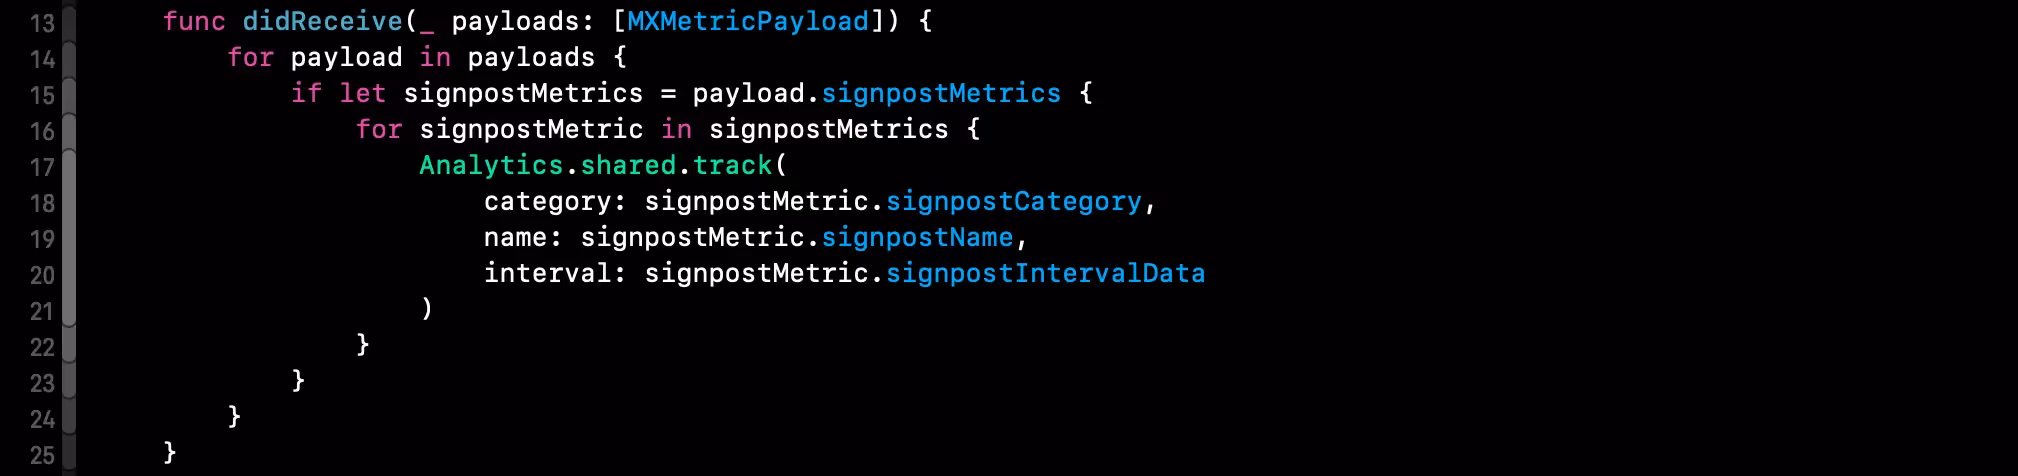
Note: signpostIntervalData property of signpostMetric variable has complex structure so you need to add extra logic to get data you need (basically duration of request).
Conclusion
Users will decide whether to revisit your app based on how it performs, not how it is developed. So measuring your iOS app performance is critical for both user’s satisfaction and your business goals. With MetricKit, you can monitor a lot of performance metrics of your iOS app simultaneously in three simple steps. This is an excellent tool to keep your iOS app user-oriented and well-performing.


.avif)